
Many organizations utilize the powerful capabilities of Esri ArcGIS and Microsoft Power BI to produce maps, reports, and dashboards. Esri ArcGIS is primarily known for its robust geospatial analysis and visualization capabilities, while Power BI is known for data analytics and interactive reporting. MBS addressed the challenge of using these two systems to share natural resources data and analysis across a large organization by leveraging ArcGIS for Power BI. ArcGIS for Power BI is a data visualization tool built into Microsoft Power BI that allows users to combine geo-enabled data with Power BI datasets. This blog provides six tips and tricks MBS would like to share to help you get started with ArcGIS for Power BI.
Here are six tips and tricks for making the most of the ArcGIS Maps Visual in Power BI:
- Combine your Power BI data with map(s) or map layer(s) on ArcGIS Online.
Make sure that the data you are loading into Power BI is related to and connects to the map(s) and feature layers(s) that you are accessing on ArcGIS Online. This process is comparable to a table joined by attributes in ArcGIS Pro. The data you are loading into Power BI must have a shared identifier field to the map layer(s) you are accessing in ArcGIS Online.
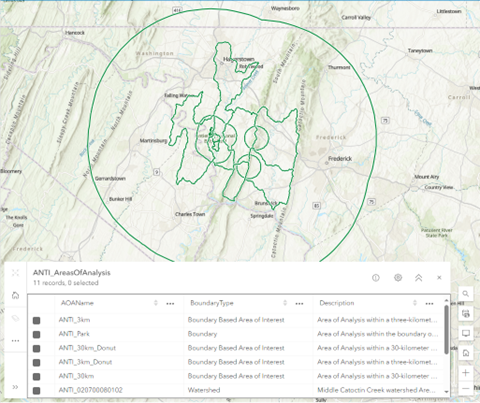
For example, this project uses two fields – “AOAID” and “AOAName” – as the unique identifier. The first image shows a glimpse of the data table that will be loaded into Power BI. There is an ‘AOAID’ field that contains different names that tie data to a single polygon feature. The second image shows the feature layer loaded into ArcGIS Online. The data table for the feature layer contains a field “AOAName”. This field holds the names of each polygon feature in the map that matches the AOAID values in the dataset.
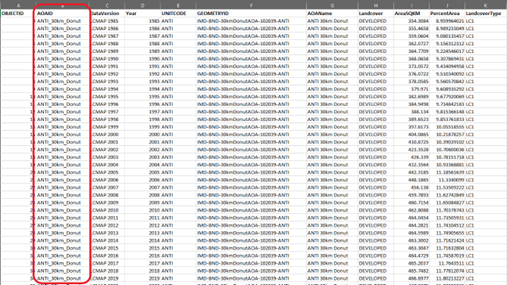
The AOAID/AOAName fields can be used to join the dataset to the feature layer in ArcGIS Online, tying data to the correct polygon feature. Note that the field names are different, this does not affect the ability to join the table to the feature layer. However, the values within each field must match for the join to work.
*Hint: you can test whether the join fields you have created will validate in Power BI by pulling your dataset and feature layer into ArcGIS Pro and running the Join Field data management tool. If the join validates here, it should work in Power BI.
- Publish polygon or point features to ArcGIS Online as a single feature layer.
While you can publish each polygon/point location you want to layer onto your Power BI visualization separately, it is important to consider the end-user’s experience. The ArcGIS for Power BI visual only allows one join to be active at a time. This means, that if you want all ArcGIS Online features to work interactively, you should consider publishing your features to ArcGIS Online as a single feature layer. You may have to think creatively about displaying your features in a web map this way, but it can greatly reduce the number of joins needed, the input/interaction needed from end users to power the visualization, and allows the end user to seamlessly click through features and explore data. - Join your layers to your Power BI data.
Now that you know that the data you have loaded into Power BI and the map(s)/feature layers(s) in ArcGIS Online are related, use the layer join feature to connect the pieces of your feature layer to the “fact” table in your Power BI model. This requires verifying that each of your layer features in ArcGIS Online have unique identifiers and that those same unique identifiers are present in the “fact” table of the Power BI model. With this join in place, you can treat an ArcGIS layer as another dimension table in your Power BI data model.

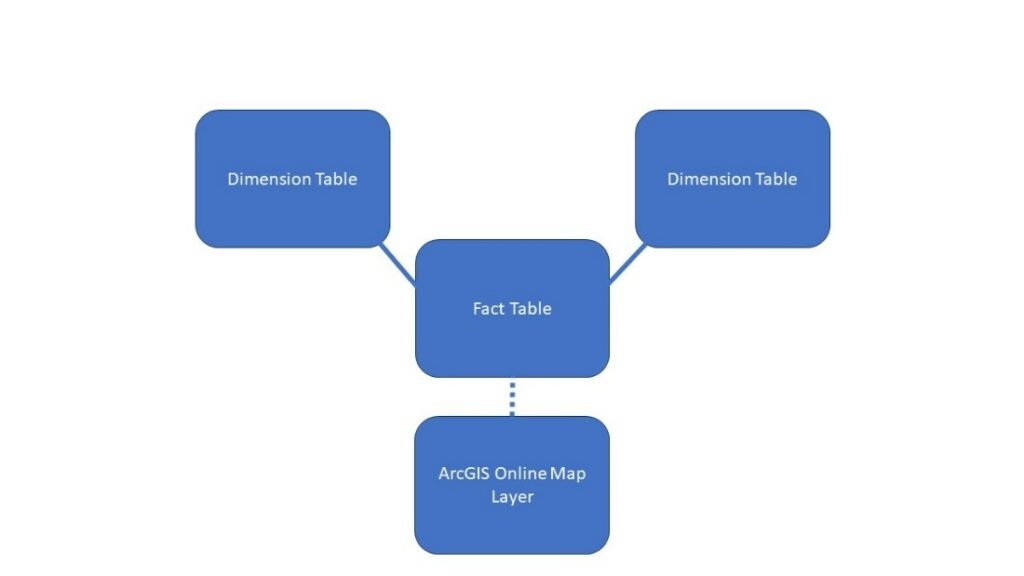
Be mindful that each map layer can only be joined to one fact table from the Power BI data model. There are many possible solutions to this issue: adjusting your ArcGIS Online layers, making report purpose changes, transforming data sources, separating the report into multiple, rewriting report measures, and more. Make sure to carefully consider your options and pick the best one for your specific situation.
- Make sure your ArcGIS Online map(s) or map layer(s) is/are shared with your audience.
If you publish your data to ArcGIS Online and choose to share it at the public level, anyone with report access will be able to see publicly available maps and map layers. However, if you have sensitive/protected content and publish to ArcGIS Online as either private, organization level, or with groups, Power BI will ask each viewer to sign into their ArcGIS account before it allows the ArcGIS map visual to load within the report.
The Power BI report builder will need viewer access to map/map layers in ArcGIS Online (this means they need at least a “Standard” license for ArcGIS Online, this licensing is separate from their Power BI licensing). ArcGIS Online Shared Update Groups are an excellent way to both organize your content for easy access in building the Power BI report and for making sure that the map(s) or map layer(s) stay up to date.
Click here to learn more about sharing permissions in ArcGIS Online.
Click here to learn more about the needed ArcGIS Online licensing for Power BI. - Make sure your users know how to activate the join and use the ArcGIS Online layer with the other Power BI visuals on your page.
To activate the join and have the report page visuals work interactively with the layer:
• Click to open the menu on the ArcGIS Map visual.
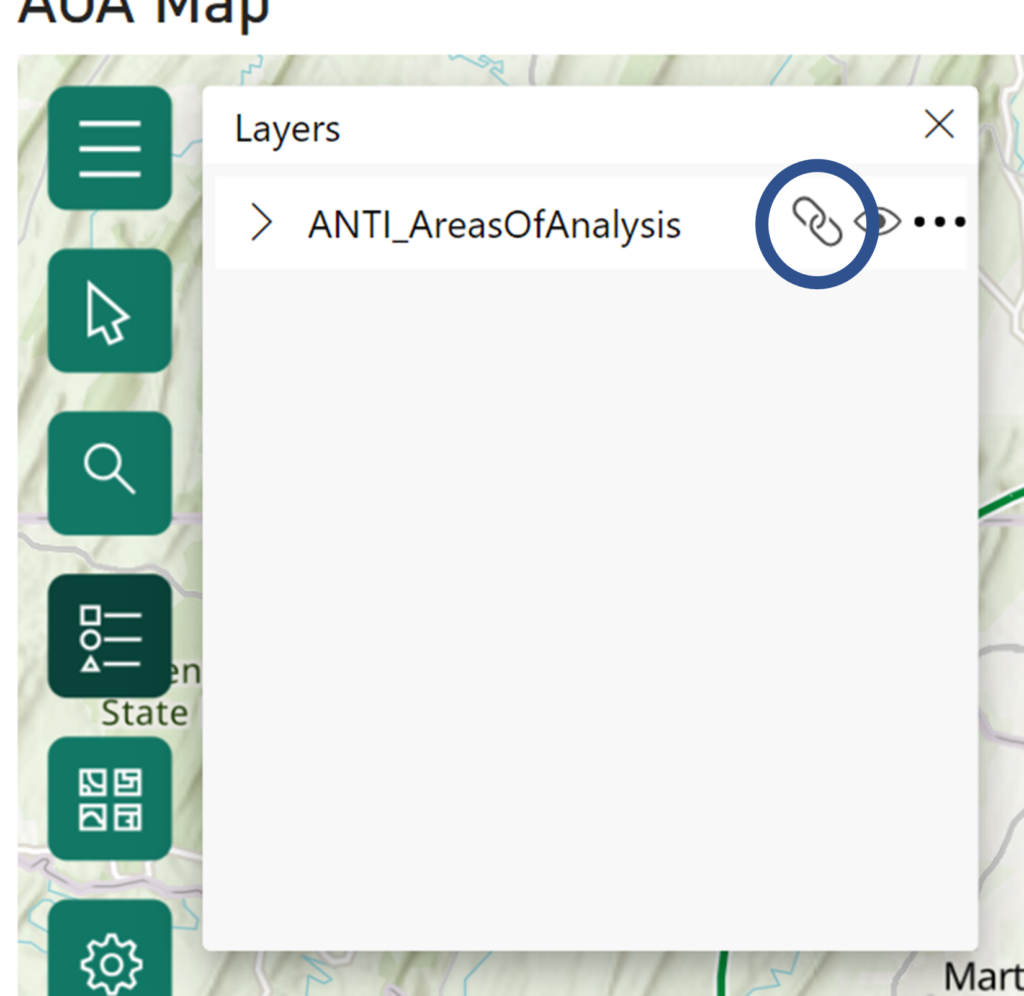
• Select the layers option to reveal all the layers present on your map.
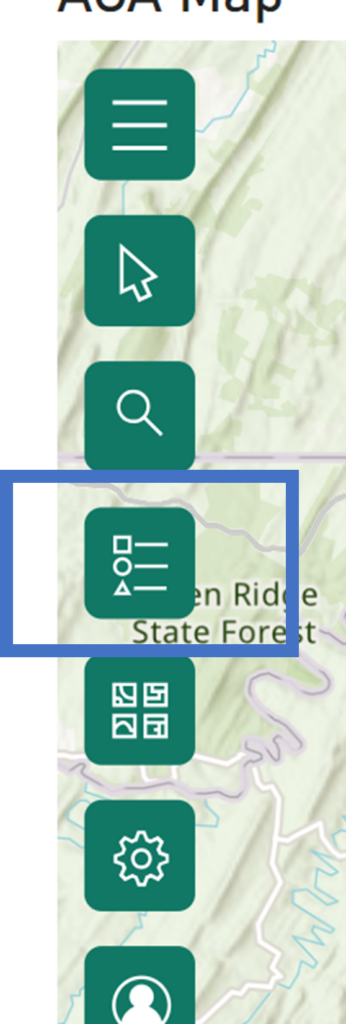
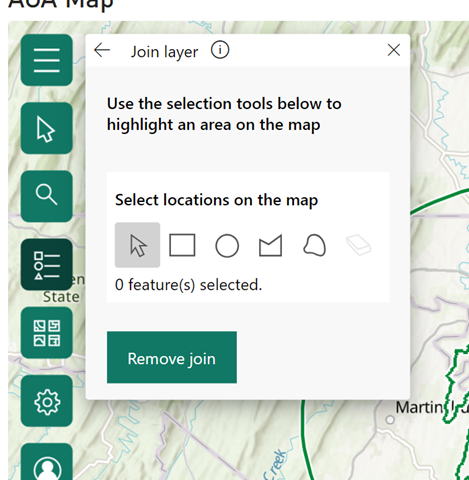
• Click on the join link symbol to activate the interactivity.
Be careful not to close the join link box, it closes the interactivity and locks the map to whatever state it is filtered at when closed.
- Make sure you are sharing your Power BI report where your audience can access it.
Accessing Power BI content depends on two major things: licensing and Power BI premium capacity.
• Without a premium capacity, users need at least Power BI Pro licenses to access content.
• With a premium capacity, users need a license to share and build content but do not need a license to access the content.
Click here to read more about sharing Power BI content.
These tips were provided by Alison Webering and Summers Cleary. Let us know how we can help you get started with or elevate your usage of Power BI and the Microsoft technology stack or ArcGIS Online and the ESRI technology stack.
MBS specializes in providing organizations with the most innovative, suitable, and sustainable geospatial technology solutions. MBS has expertise in Enterprise GIS, Geospatial Analysis, Spatial Data Enablement, Systems Integration, and Custom Development. For more information on this blog topic or MBS’ geospatial capabilities, please contact Kathleen.martin@mbshome.com