
By Anna Shomsky
My maiden name, Venishnick, is spelled incorrectly in different ways on both my daughters’ birth certificates. I understand how this can happen. When I gave birth to my older daughter, the hospital was undergoing renovations, and there was an endless pounding of a sledgehammer eight hours a day. Under those conditions, I’m amazed the nurse who took down our information got it almost correct. (She spelled it Yenishnick.)
Data collection errors like this occur all the time. If a baby is born and doesn’t yet have a social security number, data entry staff often put a parent’s social security number as a placeholder, then never update it. Default dates are common when a date is required, but the birth date or death date or hire date is unknown.
Systems can plod along with a certain amount of bad data, though it can lead to getting frequent calls from customers who have issues. And when it comes time to do a data conversion – to send your data to a new system – these bad records cannot be brought into the new system.
To identify these types of issues when you’re doing a data conversion, you often have to create thousands of Quality Assurance tests.
Wading through the results of QA tests is time-consuming, and it often doesn’t give a full picture of the state of the data. At MBS, we are solving this challenge by providing a visual dashboard that represents all the QA in one place, tracks data improvements over time, and easily links a QA test to the records that have errors.
So, for example, if a QA test checks for cases where the social security number and birthday are the same for two different records but the last name is off by a letter, we can click on the name of the test and see the records for Yenishnick and Venishnick pop up.
MBS created the Data Warehouse as a Service product, which incorporates a database, a series of procedures, over a hundred QA tests, and an interactive Power BI dashboard that allows users to see an overview of issues and drill through to individual records.
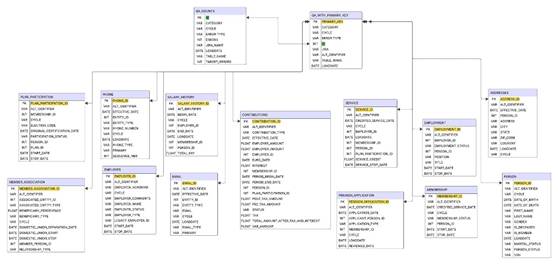
To make this dashboard, we first had to generate sample pension data that did not contain Personally Identifiable Information (PII). We agreed on a list of tables that are common to most pension projects and decided to populate those. Below is the Entity Relationship Diagram (ERD) for the Data Warehouse.
We then generated fake data in Python using the Faker library, which can generate names, addresses, and dates. We created a demographic table in Python, exported it to a csv, then imported it into an Azure Synapse SQL database. From there we created employment and pension data based off of the generated birth dates. Here we made updates and additions to the data so that there would be irregularities that would arise during QA. That is, if there was a Venishnick in the data, we added a Yenishnick.
We then created a series of procedures that would transform the sample source data and populate the tables in the above ERD. We made four sets of procedures to mimic four consecutive data cycles. The first set of procedures represents the earliest cycle, where most issues in the source data carry over to the staging tables. The next set of procedures represents the second cycle, where some issues were fixed and others reduced the number of errant records. The next two cycles continued that pattern.
We developed over 100 QA tests to identify issues in the data. (A typical pension project has thousands of QA tests.) QA test examples include finding records where a member has no address, finding members whose beneficiary percentage added to greater than 100, or finding members who have overlapping dates in the salary table. For this project, QA tests were run against the data in the SQL database, then the results were imported into Power BI.
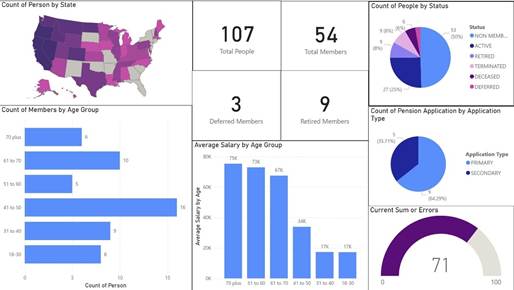
In Power BI, we created an introductory dashboard that gives a snapshot of the data at the current point in time. For this warehouse, that means the data after Cycle Four. The Power BI dashboard shows how many members there are, what their statuses are, their geographic location, their salary range by age, and a comparison to KPI.
The next page has a list of every QA check divided by category and table. It shows the change over the four cycles for each test. You can filter this page by the person’s status, you can change from a view of the total count of errors to a view of the percentage of the table the erroneous records represent, and you can drill down to the individual records.
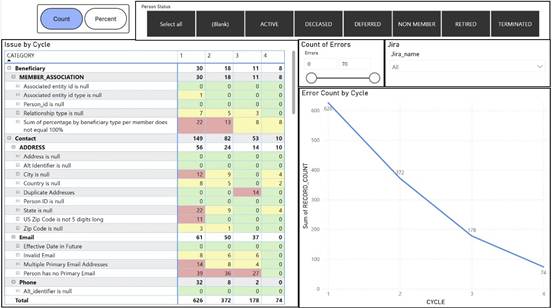
The report is coded green, yellow, and red, with green being for QA checks that return zero issues, yellow with one to ten issues, and red being greater than ten.
On this page, if you click on any test, you can drill down to a screen that lists every record that has that error. It gives you the primary key, the person the record belongs to, as well as other relevant information for the record.
For example, below is the drill down page for the error “Phone Number is Less Than 10 Digits” in Cycle Two.
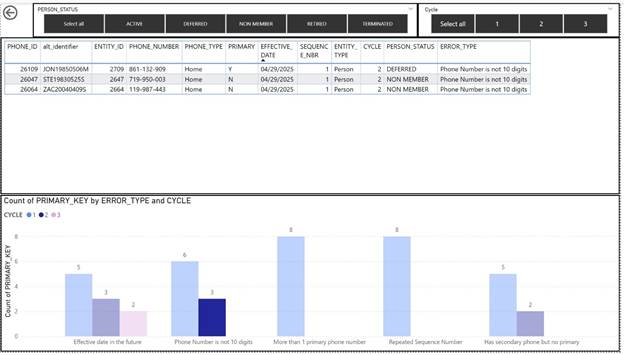
You can access these detail pages either by drilling down to them or by going to them directly. There is one page per staging table. Within the page, you can filter by cycle and person status. You can also use the graph at the bottom to filter by test.
The final slide is a Q and A slide. It uses Power BI’s native Natural Language Processing to answer a question or create a visual based on a prompt. Below are some samples of what the Q and A can produce.
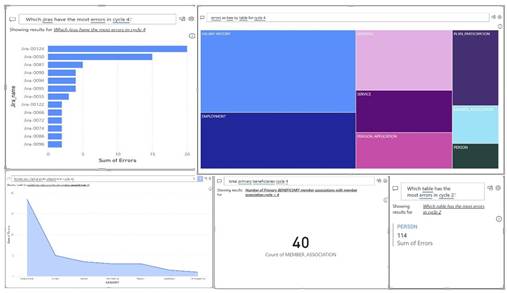
The dashboard and reports are configurable per client needs, and the Q and A slide allows anyone with access to ask a question of the data or produce a visualization.
This system makes QA transparent and easily navigable. It allows you to filter the results of QA tests so you can, for example, filter out any deceased people who have invalid phone numbers, as they are unlikely to be accepting calls.
This ability to go from the big picture of the overall state of the data to quickly drill down to individual records makes troubleshooting and data cleansing much easier. It also helps with tracking the status of the project and making decisions about which issues to prioritize.
And, finally, it’s pretty to look at.